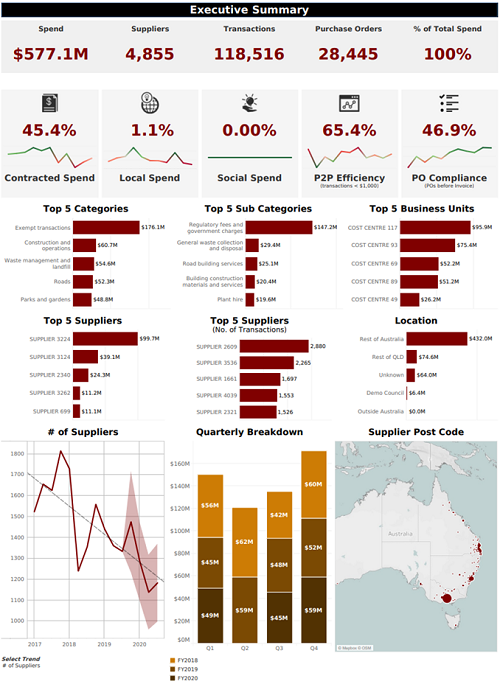
Procurement Data Talks - Executive Summary
| Next Article |
 Written by Glen Duff, Director - Strategy and Partnerships
In this monthly series of procurement data discussions, we visit a new dashboard in detail. These dashboards are part of a full suite of 12 configurable reports provided to all Queensland councils under Local Buy’s procurement technology and data program.
We’ll share our thoughts about how council can use each dashboard to support both their operational and strategic priorities, ultimately supporting council delivery and outcomes.
This month we look at the Executive Summary dashboard (example on the right).
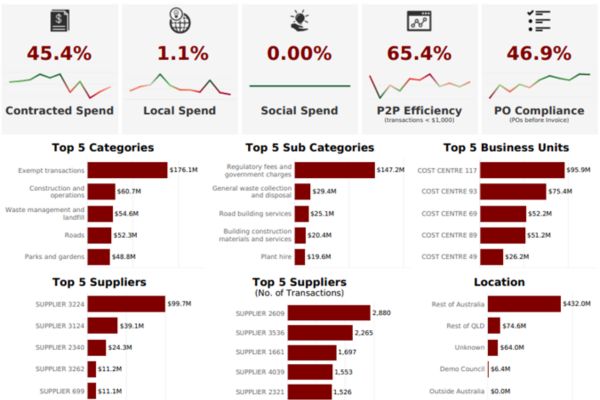
The Executive Summary serves as a high-level executive window into your council’s procurement landscape, offering a snapshot of vital metrics that emphasise strategic insights for further exploration via other detailed reports.
Key components of the Executive Summary include:
Transactional Analysis
- Examining the number of transactions sheds light on the volume and frequency of procurement activities. This analysis is crucial for streamlining processes, identifying inefficiencies, and optimising transactional costs. Comparing it across periods provides further insights into trends.
Contracted Spend
- Evaluating the portion of spend covered by contracts provides insights into compliance levels and opportunities for maximising contract utilisation, ensuring cost-effectiveness and reduced risk to council.
Local and Social Spend
- Assessing the extent of local and social spend aligns procurement spend with local and social goals. These metrics also highlight council’s commitment to supporting their local communities via economic and societal development.
- Geographical analysis of supplier locations also helps in understanding the distribution of suppliers, supply chain risks, and opportunities for diversification.
P2P Efficiency
- P2P Efficiency measures the % of transactions under $1000. The greater the % means the less efficient council P2P efficiency is. This metric may highlight areas of potential efficiency gain, where council has excessive resourcing dedicated to processing a high number of low valued invoices.
PO Compliance
- Purchase Order compliance measures the % of invoices that had a PO raised before invoice date, a critical compliance measure for council. Council who providing purchase orders as the official document issued by a purchaser for the purchase (prior to invoice) will reduce non-compliance, risk, and audit concerns.
Top 5 Metrics
- Categories & Sub-Categories: Identifying the top categories and subcategories of spend enables focused analysis and informed strategies for cost management and optimisation, budgeting and financial planning, supplier relationship management, risk mitigation and operational efficiency. Ensuring council’s category spend is under Local Buy Arrangements, where available, will further support council compliance levels.
- Suppliers: Identifying top suppliers aids in effective supply chain and procurement strategies, supporting risk management, cost optimisation, supply chain resilience, quality assurance, fostering of strategic relationships and negotiating favourable terms.
These insights are just some of the data points available within the Executive Summary dashboard. For Local Buy’s member councils, this dashboard serves as a powerful tool for procurement and other organisational stakeholders to gain a high-level understanding of procurement data which lays the foundation for further exploration.
If you would like to know more, please get in contact with Glen Duff, Director Strategy & Partnerships, Local Buy via gduff@localbuy.net.au