Procurement Data Talks - Category Overview
| Next Article |
Written by Glen Duff - Director Strategy & Partnership, Local Buy
In this monthly series of procurement data discussions, we visit a new dashboard in detail. These dashboards are part of the full suite of 12 configurable reports provided to all Queensland councils under Local Buy’s fully funded procurement technology and data program.
We’ll share our thoughts about how council can use each dashboard to support both their operational and strategic priorities, ultimately supporting council delivery and outcomes.
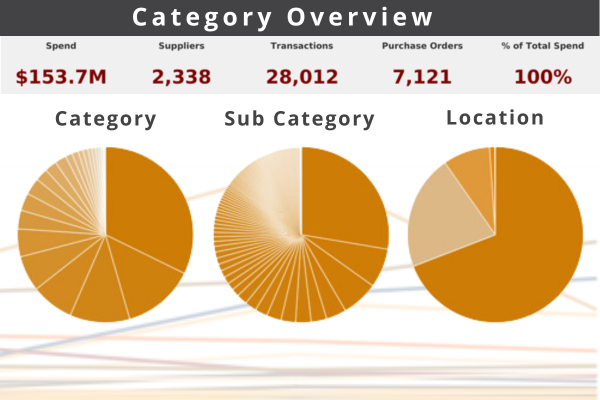
This month we’re looking at the Category Overview dashboard (example below).
Category reports are vital for councils to analyse and optimise spend patterns across different categories of goods and services. This assists council in procurement budget allocation, identifying areas of potential savings and pursuing opportunities for strategic sourcing initiatives. By understanding the distribution of spend across various categories, council can make informed decisions about supplier selection, negotiation, and overall procurement strategies.
Under Local Buy’s procurement technology and data program, council’s full procurement spend profile is processed into ‘category’ and ‘subcategory’ tht align with the national procurement network categorisation taxonomy. To achieve this, raw data reports from councils’ finance system are processed by our service provider into meaningful dashboards. The hard work is done for council and then updated quarterly.
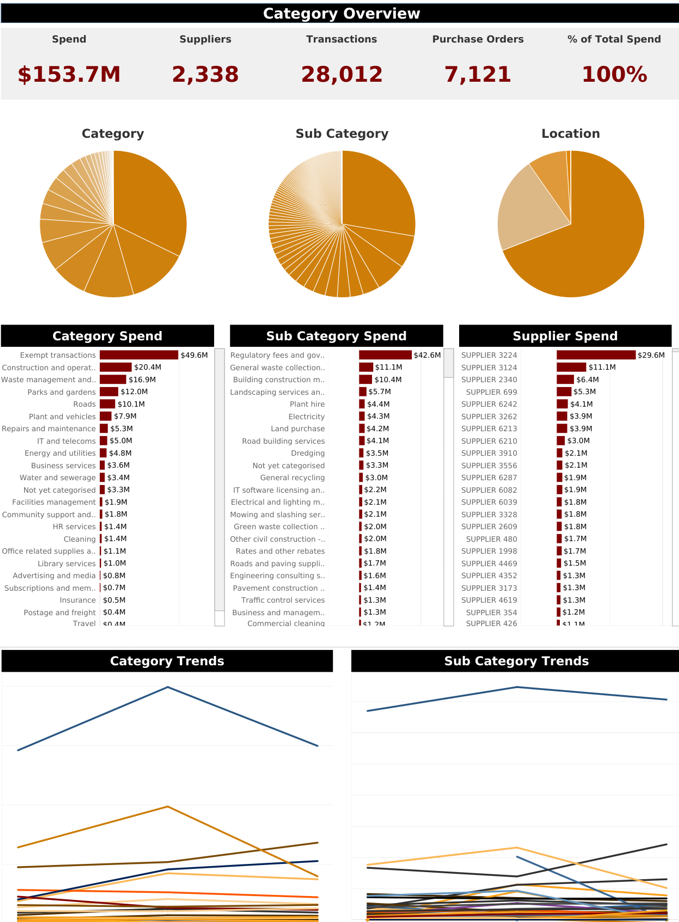 Key components of the Category Overview report include:
Category: Council spend profile is processed to high-level categories i.e., Construction and Operations, IT and Telecoms, Roads or Plant, and Vehicles to name a few. By understanding the distribution of spend across high-level categories, council can prioritise their efforts and resources towards the most significant areas of expenditure.
Subcategory: Spend within each high-level category is processed into subcategories, which distributes spend further for more focused analysis. For example, under Construction and Operations are Building Construction, Engineering Consulting, Dredging etc. This level of detail enables council to focus on strategic sourcing initiatives and cost-saving opportunities in the most impactful subcategories.
Supplier Spend: Easily identify supplier spend amounts linked to each category and subcategory. By analysing supplier spend at this level, council can identify areas where they are overspending or better understand the distribution of spend across suppliers. This granular level of insight enables council to target specific categories for analysis.
Location: By analysing supplier location, councils can identify opportunities to support their local businesses and local economic development. This can enhance councils’ reputation and strengthen its ties to the community by supporting local businesses. Councils can also identify which categories and subcategories of supply are (or are not) provided by local suppliers, supporting informed strategies that focus on local supplier attraction and retention.
Category Trends: Understanding historical spending patterns and identifying trends enables council to make accurate budget forecasts and allocate resources effectively. This can help inform strategic procurement planning and initiatives to obtain the best outcomes for council.
By leveraging these reports, councils can optimise spend, improve supplier performance, and contribute to the overall financial health of the council.
Here are some additional tips to help you use these procurement reports effectively:
- Do not be afraid of the data. It is easy to read these reports and quickly identify opportunities for council. Start byexploring what you can learn.
- Use a variety of reports to get a complete picture of your procurement performance. Don't rely on just one type of report.
- Share your reports with the appropriate stakeholders. Make sure that the people who need to see the reports have access to them. Collective thinking can deliver great data results.
- Use your reports to take action. Don't just generate reports and then file them away. Use the information in the reports to make improvements to your procurement processes.
These insights are just some of the data points available within the Category Overview dashboard. For Local Buy’s member councils, this dashboard serves as a powerful tool for procurement and other organisational stakeholders to gain an overview of procurement category data which lays the foundation for further exploration.
If you would like to know more or need support in understanding your reports, please get in contact with Glen Duff, Director Strategy & Partnerships, Local Buy via gduff@localbuy.net.au.